
April is usually the start of a spring housing market ramp-up, but this year the new mortgage stress test and rising mortgage rates have continued to be a negative factor. Those expecting an early-stage pick-up marking an end to the payback for sales pulled forward into the fourth quarter of last year have been sorely disappointed. Local real estate boards in Toronto and Vancouver announced that activity was weak in both markets in April–down just over 32% in Toronto and by 27.4% in Vancouver relative to a year ago. In Toronto, the weakness in April reflected at least in part a decline in new listings as would-be sellers might still find it hard to list at today’s lower prices for single-family homes.
Price-wise, developments last month should please policy-makers. Toronto’s aggregate benchmark price fell below year-ago levels (which constituted all-time highs in the area) for the second-straight month by 5.2%—providing some much-needed affordability relief. Single-detached prices (down 10.3% year-over-year) contrasted starkly with condo prices (up 10.2%). On a year-over-year basis, the drop in the aggregate price virtually matched the decline recorded during the 2008-09 recession.
The annual rate of benchmark price increases in the Vancouver region has slowed as well in the past two months. In April, that rate eased back below 15% for the first time since November last year. The deceleration isn’t doing much yet to improve affordability in the area, but it will be considered a sign that the market might be changing course away from overheating. The suite of market-cooling measures announced in the 2018 BC budget is poised to keep prices on this decelerating path over the coming months.
On a national basis, data released today by the Canadian Real Estate Association (CREA) show a 2.9% decline in home sales from March to April to the lowest level in more than five years (see chart below). About 60% of all local housing markets reported fewer sales, led by the Fraser Valley, Calgary, Ottawa and Montreal.
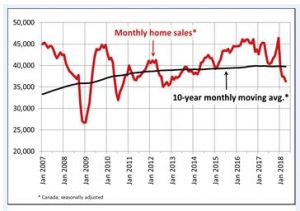
Actual (not seasonally adjusted) resale activity was down nearly 14% compared to April of last year and hit a seven-year low for the month. It also stood almost 7% below the 10-year average for the month.
Activity was below year-ago levels in about 60% of all local markets, led overwhelmingly by the Lower Mainland of British Columbia and by markets in and around Ontario’s Greater Golden Horseshoe (GGH) region.
As expected, this year’s new stress test lowered activity not just in the red-hot markets, but it has destabilized market balance for housing in Alberta, Saskatchewan and Newfoundland and Labrador about which CREA warned the government. As provinces whose economic prospects have faced difficulties because they are closely tied to those of natural resources, it is puzzling that the government would describe the effect of its new policy as intended consequences,” said Gregory Klump, CREA’s Chief Economist.
New Listings
The number of newly listed homes declined 4.8% in April. Having reached a nine-year low for the month, new listings stood 12% below the 10-year monthly moving average.
With sales having fallen by less than new listings, the national sales-to-new listings ratio firmed slightly to 53.7% in April compared to 52.6% in March. The long-term average for the measure is 53.4%. Based on a comparison of the sales-to-new listings ratio with its long-term average, about 60% of all local markets were in balanced market territory in April 2018.
The number of months of inventory is another important measure of the balance between housing supply and demand. It represents how long it would take to liquidate existing inventories at the current rate of sales activity. There were 5.6 months of inventory on a national basis at the end of April 2018, the highest level since September 2015. The long-term average for the measure is 5.2 months.
Home Prices
On a national basis, the Aggregate Composite MLS Home Price Index (HPI) rose 1.5% year-over-year (y/y) in April 2018. This marks one full year of decelerating y/y gains. It was also the smallest y/y gain in prices since October 2009.
Decelerating y/y home price gains largely reflect trends among GGH housing markets tracked by the index. Home prices in the region have stabilized and have begun trending higher on a monthly basis; however, rapid price gains recorded one year ago have contributed to deteriorating y/y price comparisons.
Condo apartment units again posted the most substantial y/y price gains in April (+14.7%), followed by townhouse/row units (+6.5%). By contrast, one-storey and two-storey single-family home prices were down (-1.1% and -4.8% y/y respectively).
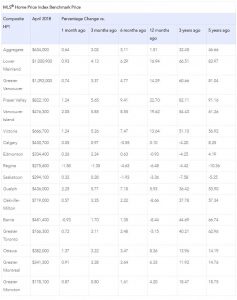
Benchmark home prices in April were up from year-ago levels in 9 of the 15 markets tracked by the index.
Composite benchmark home prices in the Lower Mainland of British Columbia continue to trend upward after having dipped briefly in the second half of 2016 (Greater Vancouver (GVA): +14.3% y/y; Fraser Valley: +22.7% y/y). Apartment and townhouse/row units have been mainly driving this regional trend while single-family home prices in the GVA have stabilized. In the Fraser Valley, single-family home prices have now also begun to rise.
Benchmark home prices continued to rise by about 14% on a y/y basis in Victoria and by about 20% elsewhere on Vancouver Island.
Within the GGH region, price gains have slowed considerably on a y/y basis but remain above year-ago levels in Guelph (+5.9%). By contrast, home prices in the Greater Toronto Area (GTA), Oakville-Milton and Barrie and District were down from where they stood one year earlier (GTA: -5.2% y/y; Oakville-Milton: -8.7% y/y; Barrie and District: -8.4% y/y). This reflects rapid price gains recorded one year ago and masks recent month-over-month price gains in these markets.
Calgary and Edmonton benchmark home prices were again little changed on a y/y basis (Calgary: +0.1% y/y; Edmonton: -0.9% y/y), while prices in Regina and Saskatoon remained down from year-ago levels (-6.5% y/y and -3.4% y/y, respectively).
Benchmark home prices rose by 8.4% y/y in Ottawa (led by a 9.4% increase in two-storey single-family home prices), by 6.3% in Greater Montreal (driven by a 7.3% increase in two-storey single-family home prices) and by 4.2% in Greater Moncton (led by a 5.6% increase in one-storey single-family home prices). (Table 1).
Bottom Line
Housing markets continue to adjust to regulatory and government tightening as well as to higher mortgage rates. The speculative frenzy has cooled, and multiple bidding situations are no longer commonplace in Toronto and surrounding areas. Home prices in the detached single-family space will remain soft for some time, and residential markets are now balanced or favour buyers across the country. The hottest sector remains condos where buyers face limited supply.
Owing to the housing slowdown, a general slowing in the Canadian economy and significant trade uncertainty, the Bank of Canada will continue to be cautious. But as inflation trends higher, we expect the Bank to hike interest rates once again this summer and possibly in the fall as well.
Last week, the Bank of Canada increased the qualifying (posted five-year fixed) mortgage rate from 5.14% to 5.34% in response to benchmark mortgage rate increases at most of the chartered banks. TD bank led the rate hikes when it increased its posted rate for a five-year fixed mortgage by a whopping 47 basis points to 5.59% on April 25.
The central bank qualifying rate is separate from the actual mortgage rates offered by banks to borrowers but is used to assess homebuyers who are seeking loans. The higher rates come as an estimated 47% of all existing mortgages will need to be refinanced in 2018, up from the 25 to 35% range in a typical year, according to a recent CIBC Capital Markets report.
A rise in government bond yields preceded the slew of bank hikes. The yield on the Government of Canada benchmark five-year bond was 2.25% this morning, compared to 1.02% a year earlier. Fixed-rate mortgages tend to move with government bond yields of a similar term, reflecting the change in borrowing costs.
Competitive pressure among the banks appears to be heating up as BMO last week offered what is possibly the largest-ever discount on variable rate loans. The bank is promoting a variable five-year mortgage at 2.45%, a full percentage point below its own benchmark rate. This morning, TD Bank joined is rival in offering a highly discounted variable mortgage rate effective until the end of the month. Canada’s lenders often provide special spring mortgage rates as homebuying activity picks up. These moves come amid slowing mortgage growth.
Borrowers still have to qualify based on the much higher Bank of Canada posted rate of 5.34%.
Dr. Sherry Cooper
Chief Economist, Dominion Lending Centres
The Angela Calla Mortgage Team will work with you personally to ensure you get the best mortgage options contact us directly at 604-802-3983 or callateam@dominionlending.ca it’s never too early or too late to start planning to position yourself best in the market.