
Orderly Housing Correction Continues
There are many unusual aspects to the current housing correction, but fundamentally the most noteworthy is how orderly and non-chaotic it has been. Home sales have slowed, but so have new listings, so the price declines are more muted than we might have expected. This is not a housing collapse. It is a housing correction. We’ve seen little distressed selling, as most would-be sellers have lots of home equity and low mortgage rates–not anxious to buy new properties immediately. Moreover, with rents surging, most potential down-sizers aren’t keen to make that trade-off.
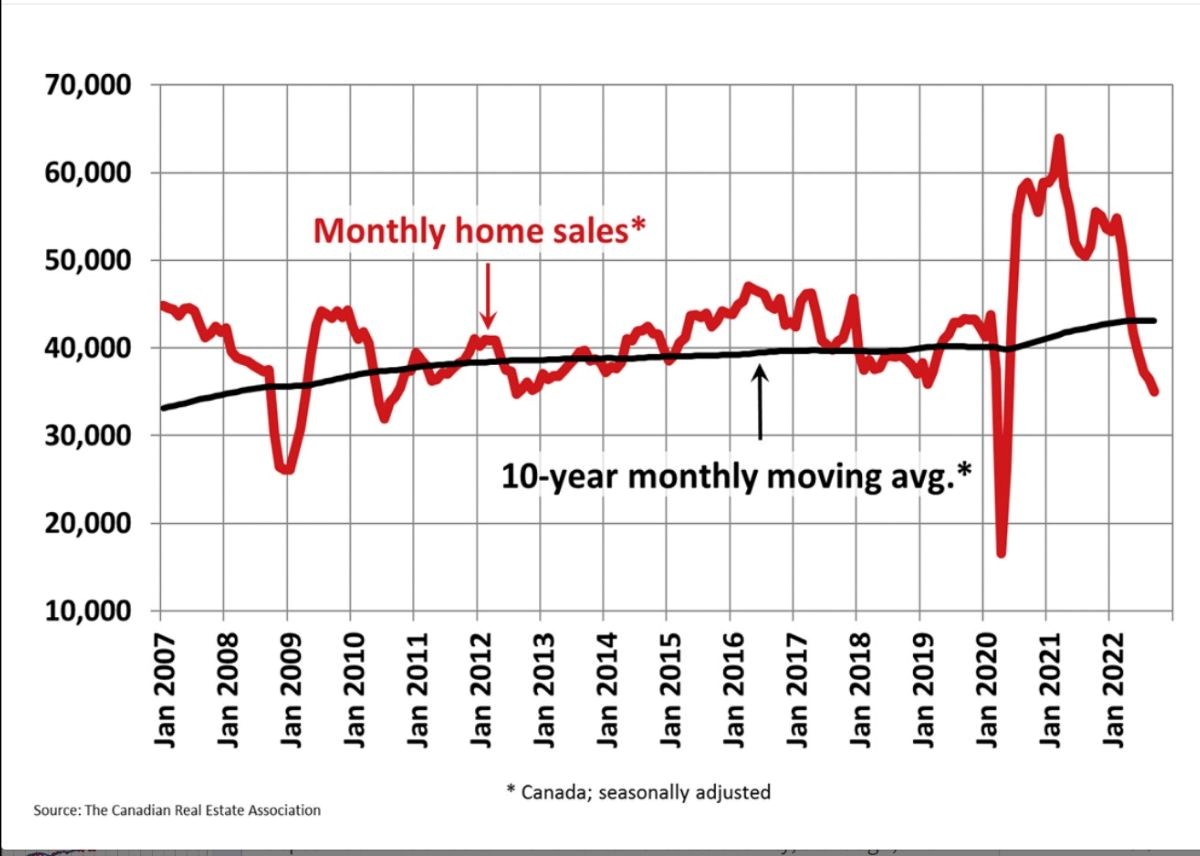
The full effects of the most recent rate hikes have not yet manifested. Statistics released today by the Canadian Real Estate Association (CREA) show that the slowdown that began in March in response to higher interest rates continued in September. Home sales recorded over Canadian MLS® Systems fell by 3.9% between August and September 2022. From May through August, month-over-month declines have been progressively smaller. The September result marked a slight increase in the current sales slowdown that began with the Bank of Canada’s first rate hike back in March.
While about 60% of all local markets saw sales fall from August to September, the national number was pulled lower by the fact markets with declines included Greater Vancouver, Calgary, the Greater Toronto Area (GTA) and Montreal.
The actual (not seasonally adjusted) number of transactions in September 2022 came in 32.2% below that same month last year. It stood about 12% below the pre-pandemic 10-year average for that month (see chart below)
“September was another month of lower sales activity, although, with many sellers also opting to play the waiting game, the market remains on the tighter side of balanced market territory,” said Jill Oudil, Chair of CREA. “It makes for an interesting dynamic, one that doesn’t really have many historical precedents. The market has changed so much in the last year, and the adjustment to higher borrowing costs is still underway.”
“Up until recently, higher borrowing costs had disproportionally affected the fixed-rate space, with buyers able to qualify more easily if they went with a variable rate mortgage,” said Shaun Cathcart, CREA’s Senior Economist. “The Bank of Canada’s most recent rate hike in early September finally closed that door, so it was not a big surprise to see additional softness on the sales side. The important thing to remember is we’re still in the middle of a period of rapid adjustment, with buyers and sellers trying to feel each other out while a lot of people have had to take their home search plans back to the drawing board. As such, resale markets may remain on the quiet side for some time yet, with the flipside of that coin being even more pressure on rental markets.”
New Listings
The supply of homes is still historically low. The number of newly listed homes edged back a further 0.8% on a month-over-month basis in September. This built on the 6.1% and 4.9% declines recorded in July and August, respectively, as some sellers appear content to stay on the sidelines until more buyers are ready to get back into the market. It was an even split between markets where new supply was down in September and those where it increased, with the most significant declines in the GTA offsetting the largest gains in British Columbia’s Lower Mainland.
Unusually, new listings would be so listless during a housing slowdown. However, the CREA data only go back 42 years, when interest rates trended sharply downward. Sellers today typically have mortgages at far lower than current rates, which no doubt dampens their enthusiasm to sell. Distressed sellers apparently listed their homes earlier this cycle, with the rest remaining on the sidelines for now. That could change if interest rates rise substantially further, although the incentives to stay in place continue high.
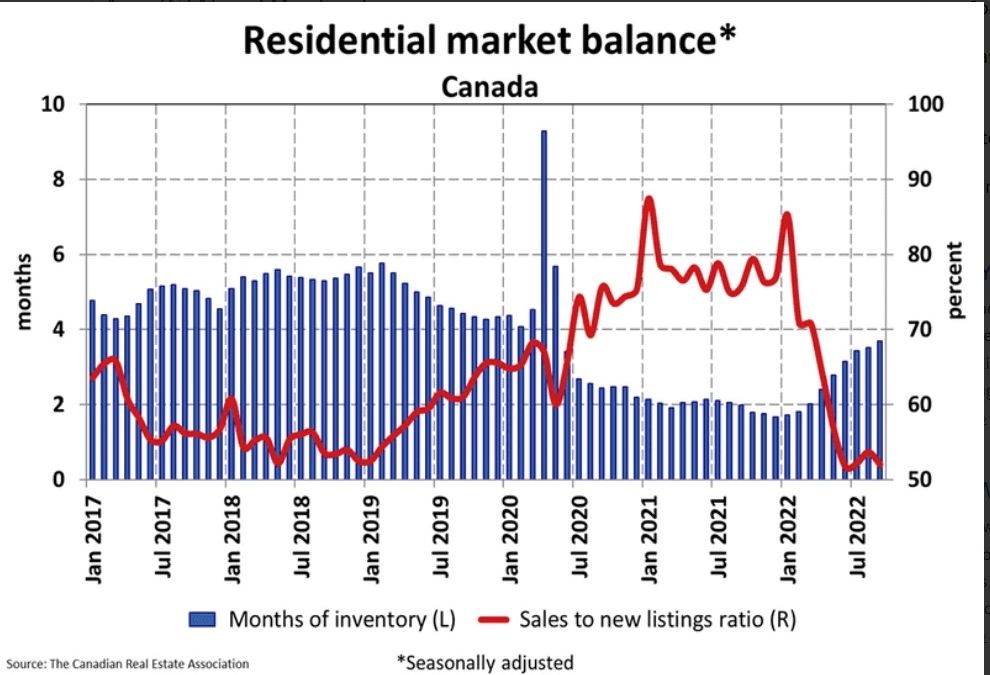
With sales down and new listings seeing a minor change in September, the sales-to-new listings ratio eased to 52% compared to 53.6% in August. The September 2022 reading for the national sales-to-new listings ratio was back on par with those in June and July and slightly below its long-term average of 55.1%.
There were 3.7 months of inventory on a national basis at the end of September 2022, up slightly from 3.5 months at the end of August. While the number of months of inventory is still well below the long-term average of about five months, it’s also up quite a bit from the all-time low of 1.7 months set at the beginning of 2022.

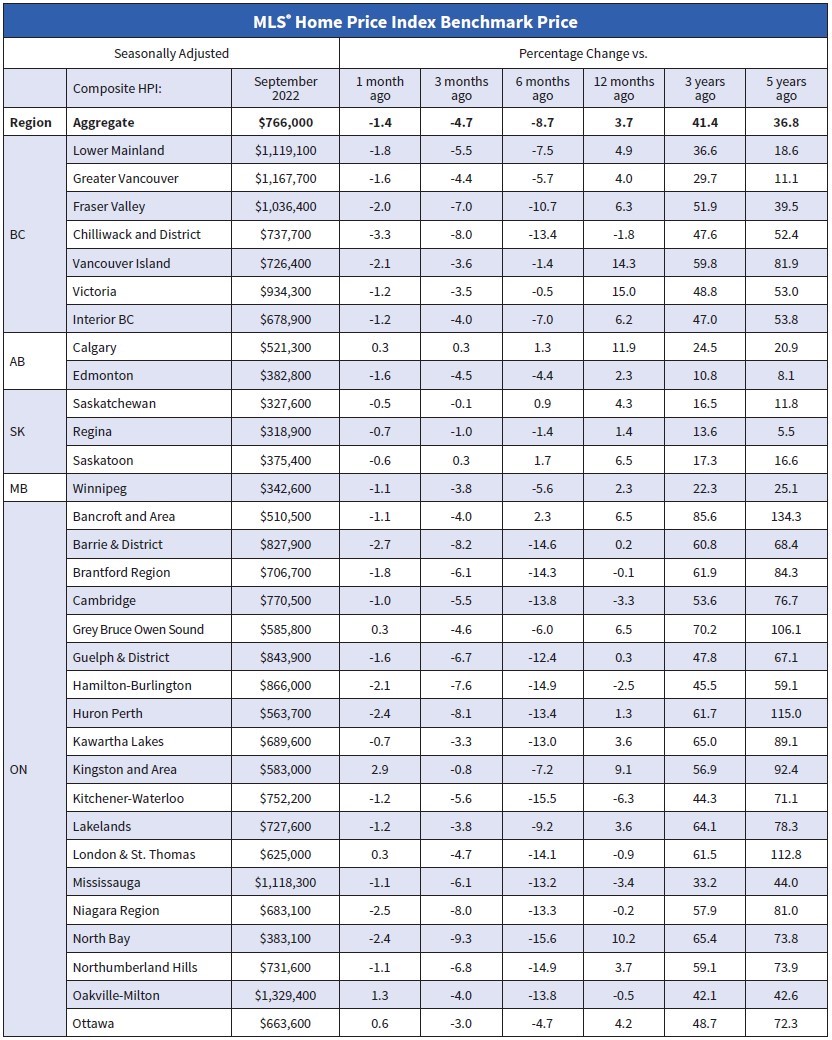
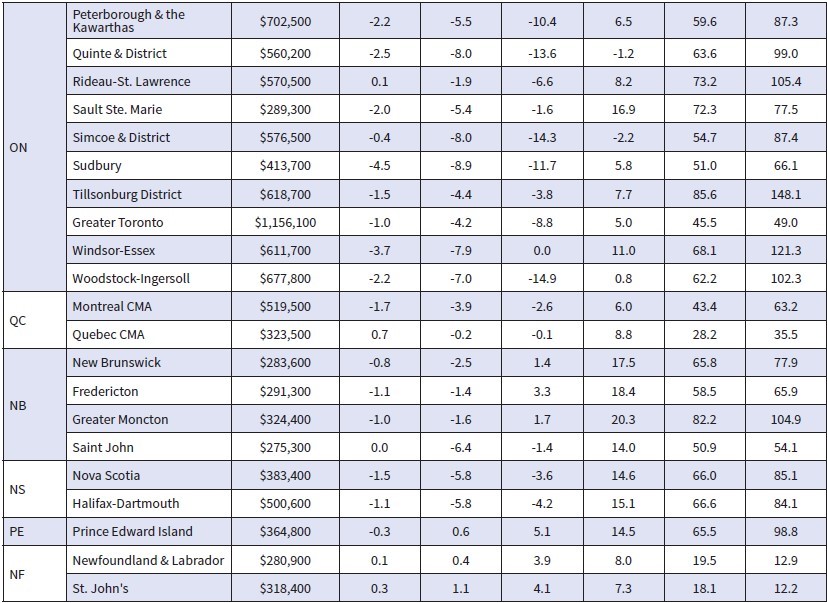
Home Prices
The Aggregate Composite MLS® Home Price Index (HPI) edged down 1.6% on a month-over-month basis in August 2022, not a small decline historically, but smaller than in June and July.
Breaking it down regionally, most of the monthly declines in recent months have been in markets across Ontario and, to a lesser extent, in British Columbia; however, in August, Ontario markets contributed most to the overall national decline.
Looking across the Prairies, prices in Alberta appear to have peaked. Prices still rise slightly in Saskatchewan, while Manitoba recorded the only decline. In Quebec, prices have dipped somewhat in the last couple of months. On the East coast, the softening of prices confined to Halifax-Dartmouth is now also appearing in New Brunswick, Newfoundland and Labrador. By contrast, prices in PEI continue to edge ahead on a month-over-month basis.
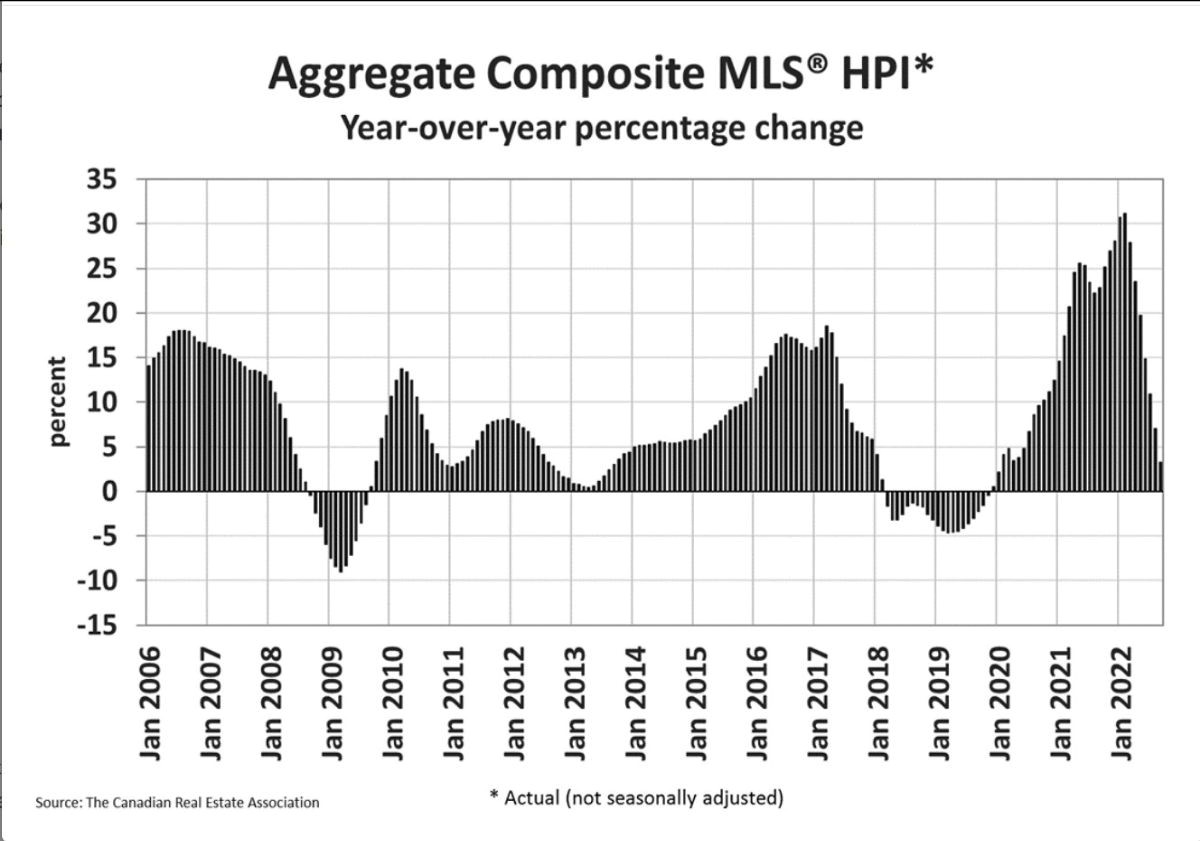
The non-seasonally adjusted Aggregate Composite MLS® HPI was still up by 7.1% on a year-over-year basis in August. This was the first single-digit increase in almost two years, as year-over-year comparisons have been winding down at a brisk pace from the near-30% record year-over-year gains logged just six months ago.
The Aggregate Composite MLS® HPI edged down 1.4% on a month-over-month basis in September 2022, not a small decline historically, but smaller than in June, July and August.
Breaking it down regionally, most of the recent monthly declines had been in markets across Ontario and, to a lesser extent, in B.C. The standout trend in August and September was that quite a few of those Ontario markets saw monthly price declines get stopped in their tracks, mainly in the Greater Golden Horseshoe. In a few markets prices even popped up a bit between August and September.
Looking across the Prairies, prices in Edmonton and Winnipeg are down a bit from their peaks, while prices are sliding sideways in Calgary, Regina, and Saskatoon. Similarly in Quebec, prices have dipped in Montreal but are mostly flat in Quebec City.
On the East Coast, price softness that had been confined to the Halifax-Dartmouth area appears to now be showing up in parts of New Brunswick and Newfoundland and Labrador, while prices in Prince Edward Island have flattened out in recent months but have not yet moved any lower. The non-seasonally adjusted Aggregate Composite MLS® HPI was still up by 3.3% on a year-over-year basis in September, a far cry from the near-30% record year-over-year gains logged in early 2022.
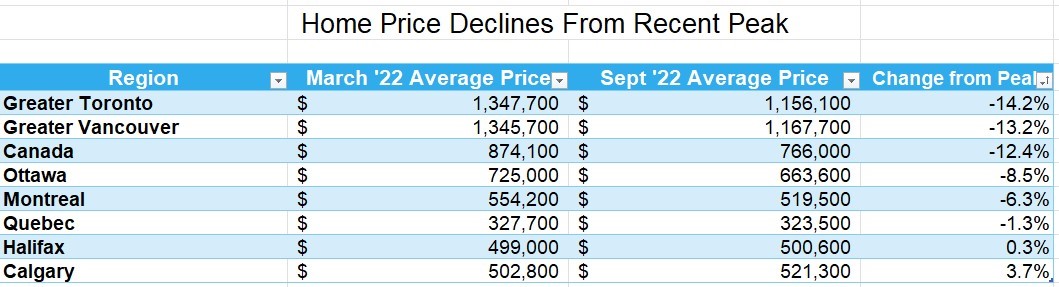
| The table below shows the decline in average home prices in Canada and selected cities since prices peaked in March when the Bank of Canada began hiking interest rates. More details follow in the second table below. The largest price dips are in the GTA and the GVA, where the price gains were spectacular during the Covid-shutdown. |
US Inflation Surprises on the High Side in September
In other news, US CPI data, released yesterday for September, show inflation remains stubbornly high, assuring another 75 bps increase in the US overnight policy rate when the Fed meets again on November 3.
A closely watched measure of US consumer prices rose by more than forecast to a 40-year high last month, pressuring the Federal Reserve to raise interest rates even more aggressively. The core consumer price index, which excludes food and energy, increased 6.6% from a year ago, the highest level since 1982. From a month earlier, the core CPI climbed 0.6%. On the heels of a solid jobs report last week and record-low unemployment, the inflation data likely cement an additional 75-basis point interest rate hike at the Fed’s November policy meeting. Even more noteworthy, however, is that immediately following the release of the inflation report, the market assessment of the maximum overnight rate rose from 4.6% to 4.85% for March of next year, substantially above the current overnight rate of 3.25%.
Bottom Line
The Bank of Canada’s next policy announcement date is October 26, when we will likely see another hike in the overnight policy target of at least 50 bps to 3.75%. Much will depend on next week’s release of the September CPI report for Canada on Wednesday, October 19. All eyes will be on the Bank’s measures of core inflation, which have been stubbornly sticky at above 5% on average. If the data disappoint on the high side, we can’t rule out a 75-bps rate hike the following week.
I believe both the Bank of Canada and the Fed will hike overnight rates further later this year and into next year. They are also not likely to begin to reverse these rate hikes until 2024.
This article is courtesy of the Sherry Cooper Assoc.
Angela Calla is an 18-year award-winning woman of influence which sets her apart from the rest. Alongside her team, Angela passionately assists mortgage holders in acquiring the best possible mortgage. Through her presence on “The Mortgage Show” and through her best-selling book “The Mortgage Code“, Angela educates prospective home buyers by providing vital information on mortgages. In light of this, her success awarded her with the 2020Business Leader of the Year Award.
Angela is a frequent go-to source for media and publishers across the country. For media interviews, speaking inquiries, or personal mortgage assistance, please contact Angela at hello@countoncalla.ca or at 604-802-3983.
Click here to view the latest news on our blog.